
Designing an Identity Risk Management System for Security Teams
An end-to-end Identities experience that helps security teams move from noisy identity signals to clear, safe action - across posture, risk analysis, and automated workflows.

OVERVIEW

I designed an end-to-end Identities experience that transforms fragmented security signals into a unified risk intelligence system.
DoControl is a SaaS security platform that protects enterprise data across cloud applications. The Identities module gives security teams visibility into who has access to what, where risk concentrates, and how to take action - all from a single, connected experience that spans posture dashboards, identity drill-downs, and automated remediation workflows.
MY ROLE
Product Designer (End-to-end)
TEAM
Design Lead, PM, 5 Engineers
TIMELINE
8 Months
THE PROBLEM
Identity risk was visible, but not actionable.
Security teams could see that something was wrong, but they couldn't easily understand why, compare across identities, or act without jumping between tools.

Identity signals were scattered
Risk data lived in silos - alerts in one place, access patterns in another, asset exposure somewhere else. Security teams had to mentally stitch together a picture of each identity's risk.

No clear risk prioritization
Without a unified risk score or benchmarking system, teams couldn't quickly answer: who should I investigate first? What makes this identity riskier than others?

Action was disconnected from insight
Even when teams identified a risky identity, they had to leave the context to take action. Workflows, alerts, and remediation lived in separate corners of the product.
PRODUCT APPROACH
Design an identity system that makes risk understandable, comparable, and actionable.
The goal wasn't just to add more data - it was to create a mental model that matches how security teams actually investigate: start with the big picture, drill into specifics, and take action without switching contexts.

Unified risk visibility
Surface a single, explainable risk score for every identity

Contextual drill-downs
Let users move from posture to details without losing context

Action from insight
Connect risk signals directly to workflows and remediation

Cross-product integration
Link identity risk to alerts, events, assets, and shadow apps

Comparative benchmarking
Help teams understand if a risk level is normal or exceptional

Clear mental model
Structure the experience so it maps to how security teams think
RESEARCH
Independent research that shaped the direction.
I led the research independently, combining AI tools, competitor analysis, and product pattern review to understand how identity risk is presented, explained, and acted on. The goal was not just to gather references, but to shape a flow that felt clear, credible, and usable for security teams.

Competitor and pattern analysis
I reviewed leading security products and related workflows to understand how complex risk information is structured, prioritized, and explained. This helped identify strong patterns for scoring, drill-downs, and progressive disclosure.

AI-assisted research synthesis
I used AI tools to accelerate research synthesis, compare approaches, and surface recurring UX patterns across products. This helped turn broad exploration into sharper product decisions.

Usability validation
After shaping the experience, I reviewed comparable flows in Datadog to validate that the interaction model felt intuitive and aligned with familiar security workflows. This gave me confidence that the structure, hierarchy, and navigation were moving in the right direction.

Usability validation
I validated the flow against Datadog’s product patterns to make sure the experience felt intuitive, familiar, and aligned with how security teams already investigate and act.
KEY INSIGHT
Security teams don't just need more data - they need data organized around decisions.
The question isn't "show me everything about this identity," it's "should I act on this, and if so, how?"
KEY EXPERIENCE
Four connected surfaces that form a complete identity risk system.
Each section was designed to work independently while maintaining deep connections to the others.
This creates flexibility - teams can start wherever their workflow demands - while ensuring context is never lost.
01
Identity Posture Dashboard
The entry point for most security teams. Shows organizational risk distribution, highlights departments and users with elevated risk, and provides immediate access patterns. The donut chart quantifies risk severity, while the geographic visualization reveals access anomalies.
-
Risk distribution across severity levels (0-40, 40-60, 60-80, 80-100)
-
User persona breakdown (VIP, Admin, Terminated, Departing, Dormant)
-
Top risky user spikes with trend indicators
-
Department-level risk aggregation


02
Risk Logic & Signals
When a user clicks into an identity, they need to understand why that score exists. This view breaks down every contributing factor - exposed assets, sensitive data access, admin privileges, active alerts, and more - with benchmarking against department and organization averages.
-
Complete risk factor breakdown with values
Benchmarking indicators vs. department/org averages -
Impact scoring to prioritize which factors matter most
-
30-day risk score trend with user/dept/org comparison
03
Access Patterns & Events
Understanding access behavior is critical for identity risk. This view shows frequent access patterns (apps, OS, browsers, locations), geographic distribution of logins, and a detailed event log that lets analysts trace specific sessions and flag suspicious activity.
-
Frequent access pattern cards (App, OS, Browser)
-
Location bounds with geographic visualization
-
Suspicious IP flagging with contextual warnings
-
Filterable access-related events timeline


04
Automated Workflows
Risk signals are only valuable if they lead to action. The workflow builder lets teams create automated responses triggered by identity risk changes - from notifications and approvals to data scans and remediation steps.
-
Visual workflow canvas with drag-and-drop actions
-
Identity-aware triggers (risk score changes, access events)
-
Query actions: PII scan, regex patterns, data classification
-
Conditional branching based on scan results
05
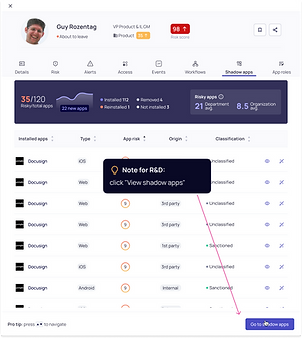
Shadow Apps & Misconfigurations
To assess identity risk, security teams need more than a score - they need the access story behind it. I designed this view to surface shadow app usage, risky access patterns, and misconfiguration signals in one place, helping analysts investigate faster and decide what needs attention.
-
Frequent access patterns across apps, OS, and browsers
-
Geographic login distribution with suspicious IP context
-
Detailed event timeline for tracing sessions and behavior
-
Clear visibility into unmanaged app usage and risky activity

CONNECTED ACCROSS THE PRODUCT
Identity risk isn't isolated — it's woven through alerts, events, assets, and workflows.
One of the biggest design challenges was ensuring that identity context appeared everywhere it mattered. When you're looking at an alert, you should see the actor's identity risk. When you're reviewing an asset, you should know which risky identities have access.

Identity
Alerts
Every alert shows the actor's full identity context - risk score, employment status, access history.
Identity
Events
Event logs link back to identity profiles, making it easy to investigate patterns across time.
Identity
Assets
Asset exposure is reflected in identity risk, and asset views show which identities have access.
Identity
Workflows
Risk changes can trigger automated workflows for notification, review, or remediation.
System Integration
The identity system doesn't just display data - it acts as a hub that connects to the rest of the DoControl platform. Alert context panels show identity cards. Event views link to identity profiles. Workflows can query identity attributes and trigger based on risk changes. This creates a network effect where improving identity data improves every connected feature.
DESIGN CHALLANGES
Complex problems that shaped the solution.
Every design project has constraints. These were the challenges that most influenced the final design - and the thinking that resolved them.
01
Balancing depth with scannability
CHALLANGE
Security teams need detailed information to make decisions, but they also need to scan quickly across many identities.
RESOLUTION
Designed a progressive disclosure system where summary views show key signals, and drill-downs reveal full context. Used consistent visual patterns (risk badges, trend indicators) that could be parsed at a glance.
02
Data availability vs. design ambition
CHALLANGE
Some ideal features required data pipelines that didn't exist yet, or would take months to build.
RESOLUTION
Prioritized features based on available data, designed graceful degradation for missing signals, and created a roadmap that let us ship incrementally while building toward the full vision.
03
Maintaining consistency across contexts
CHALLANGE
Identity information appears in multiple places (identity views, alert panels, asset views, workflows), and needed to feel coherent.
RESOLUTION
Created a shared identity card component system with multiple densities (compact for inline references, expanded for detail views), ensuring visual consistency while adapting to context.
04
Explaining risk without overwhelming
CHALLANGE
Risk scores combine many factors. Users needed to trust the score, which meant understanding what drove it - but not drowning in data.
RESOLUTION
Designed risk breakdown tables with impact indicators and benchmarking, so users could see not just what contributed to risk, but how that compared to normal. Added trend charts to show change over time.
UI LANGUAGE / COMPONENT SYSTEM
A consistent visual language across all identity surfaces.
To maintain coherence across posture views, identity details, alerts, and workflows, I developed a component system that adapts to context while maintaining visual consistency. Each component was designed with multiple densities and states.

Risk Badge
Compact risk indicator with score and trend arrow


Identity Card
Multi-density card showing user info and risk signals
Trend Chart
30-day sparkline with comparison overlays

Access Map
Multi-density card showing user info and risk signals

CLOSING REFLECTION
What I learned, and what I'd do differently.
The biggest shift wasn't adding more features - it was creating a mental model that matched how security teams actually think. When you give analysts a risk score, they immediately want to know: why? When you show them "why," they want to know: is this normal? And when they understand the risk, they want to act immediately, not switch to another tool.
Designing for this flow - posture → comparison → action - required tight integration across the product. Identity information couldn't just live in its own section; it needed to appear everywhere it mattered, in the right density for each context.
With more time, I'd invest in micro-interactions that reinforce the connection between action and outcome - animations when risk scores change, confirmations when workflows trigger, visual feedback that closes the loop. The system is there; the polish could make it feel even more responsive and trustworthy.
What Worked
-
Progressive disclosure from posture → detail → action
-
Benchmarking that answers "is this normal?"
-
Identity context appearing across alerts, events, assets
-
Component system that scaled across contexts
What I'd Explore
-
More animation to show cause → effect relationships
-
Personalized risk thresholds per organization
-
AI-assisted investigation suggestions
Collaborative features for team-based triage